Parsing, JavaScript, and Compilation Performance
JavaScript is a compiled language. You might be thinking, “But I’ve never compiled any JavaScript”? You haven’t – compiling is automatically handled by browser engines that compile JavaScript code moments before execution and then run it on the users machine. Each browser uses a different JavaScript engine, but today we’ll dive into the details of the V8 engine, used by Google Chrome.
V8 Overview
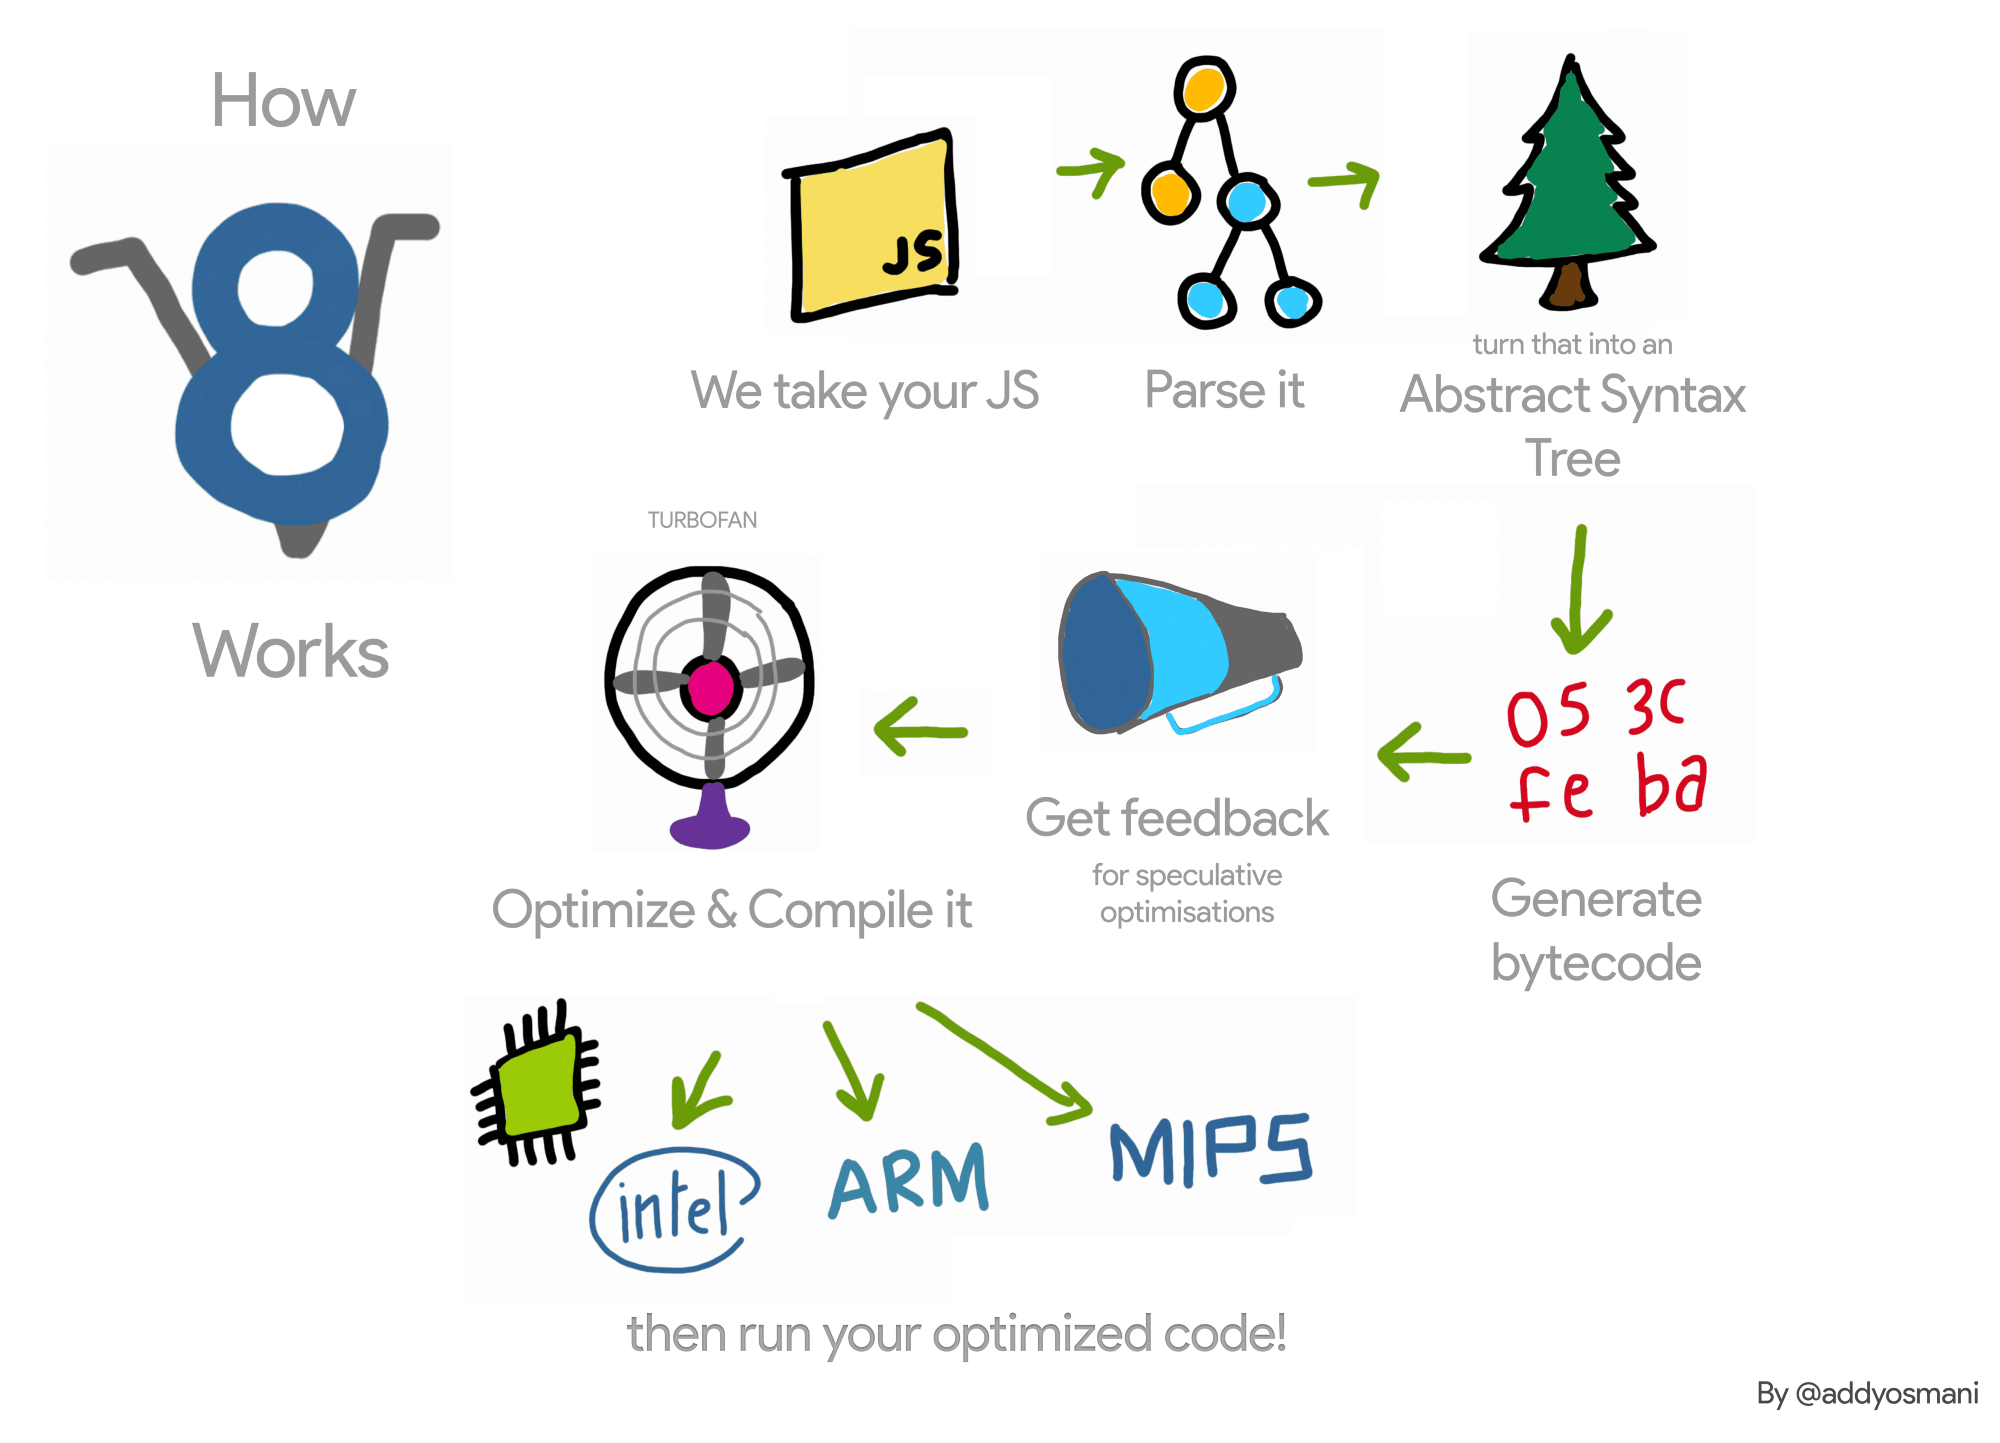
This is part two of a series on Performance. The image below is a simplified breakdown of how V8 works (taken from “JavaScript Start-up Performance” by Addy Osmani):

Whenever Chrome or Node.js has to execute some piece of JavaScript, it passed the source code to V8. V8 will start to Parse this code and then turn that into an Abstract Syntax Tree, or an AST. Essentially, an AST turns a long string of text into an actual data structure that represents your code. This demo parser helps to visualize an AST - make sure to select the Tree tab.
The AST is passed to the Ignition interpreter and converted to bytecode. The sequence of bytecodes is then executed by Ignition. Here is a helpful resource to better understand V8’s bytecode.
At this point TurboFan will consume the bytecode and attempt to generate highly-optimzied machine code. Understanding this process allows us to build sites and apps that execute JavaScript at peak performance.
Performance Example using Chrome and Node
Let’s look at an example! Assume I have a simple add function that is adding x + y together 10 million times.
let iterations = 1e7;

const a = 1;
const b = 2;

const add = (x, y) => x + y;

while (iterations--) {
  add(a, b);
}
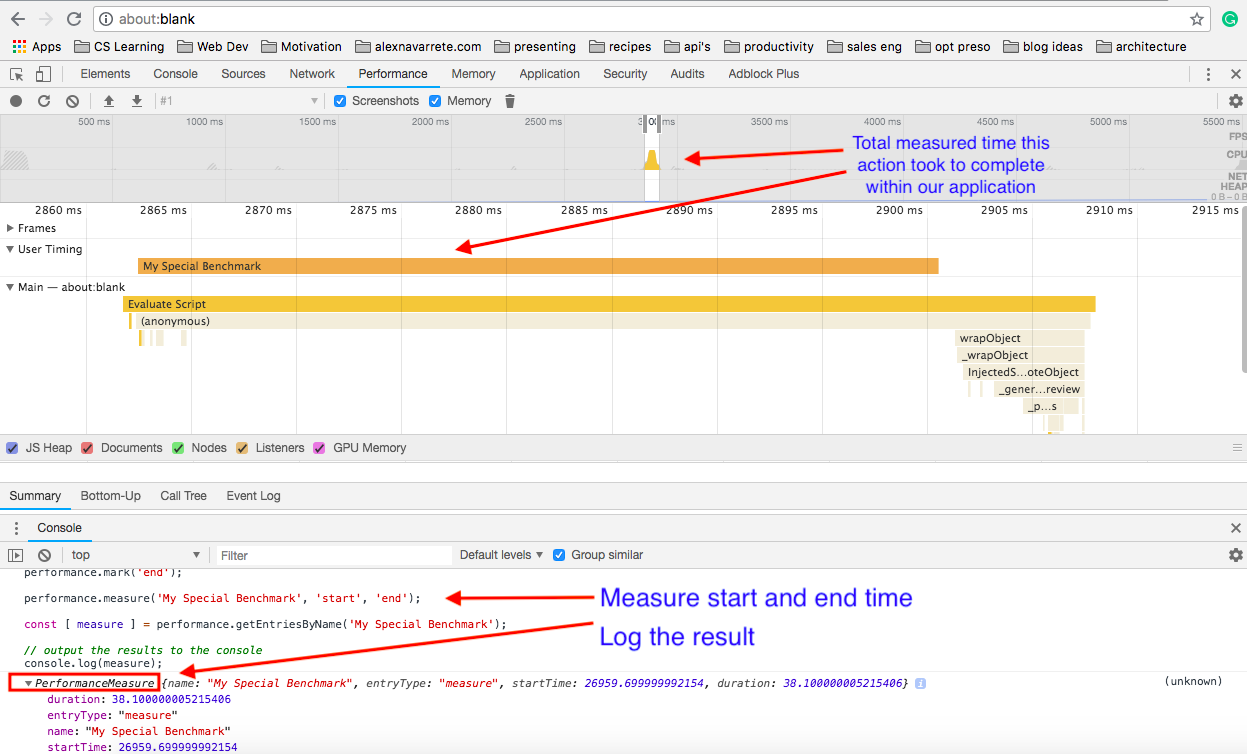
As a developer, I might want to see how long certain actions (like the add function) are taking in my application. Using the User Timing api I can set a start time, a stop time, and measure the results.
The User Timing api allows developers to to identify where your application is spending its time. This works in Chrome or in Node.
You can clone this github repo to step through the exercise in Node. Using Chrome,
- Copy the code in this gist
- In a new tab, open an about:blank window
- Open a split console, record performance, and run the code
In Chrome, the end result will look something like this:

In Node, the end result will look something like this:

Identical code was run in Google Chrome and in Node. Notice how the output logged in each example was very similar? Every time you run this function the answer will vary slightly. Feel free to edit the inputs of the function to see how that impacts overall performance.
Going Deeper into V8
If I had a function being executed 10 million times that might be a good candidate to explore and ensure it is being optimized by TurboFan. How do we know if our code is being optimized by V8?
V8 offers flags that can be invoked from the command line with Node or in the browser with Chrome. The rest of this example will move forward using this Node example. Running the --trace-opt flag will expose any optimizations made by V8.
node --trace-opt benchmark.js | grep add
I added grep add to the command so it would only output results around the add function. In this example, the result looked like this:

That output shows us that our add function was optimized by TurboFan.
Larger Takeaways
Before making any performance changes it is helpful to think deeply about the architecture and design of your application. With that in mind,
-
The easiest way to reduce parse, compile, and execution times is to ship less code.
-
1 MB of JS !== 1 MB of a JPEG- The JavaScript code needs to be compiled, parsed, and executed on the users machine. -
User Timing api is powerful to figure out where the biggest bottlenecks are happening.
-
Use an open source tool like Webpage Test to get a high level measurement of certain metrics (Load Time, First Byte, Start Render, Speed Index, Requests) for your site.
Congratulations! You just finished part two on Parsing, JavaScript, and Compilation Performance!
Any questions about Performance? Feel free to reach out. I regularly work with customers and engineers to remove their technical hurdles 🙂